Customizable drill-down options are available in dashboard widgets. You can get more information from your search queries. Using drill down in your dashboard widgets lets you look at specific details of query results.
For example, when viewing results that include the destination_address, destination_port, source_address, and source_port in the query you can drill down in each individual parameter.
Here are two scenario examples.
A widget with the following search query:
destination_address=* | timechart count() by destination_port
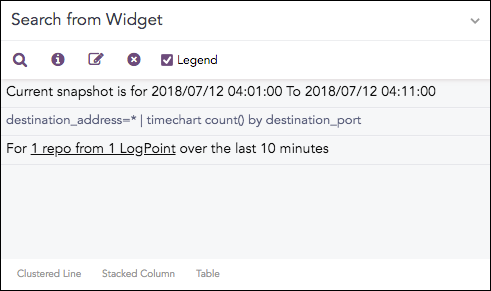
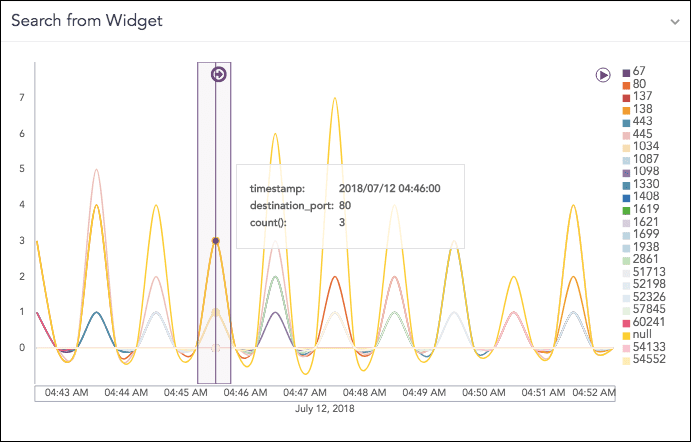
The query results are displayed as a graph.
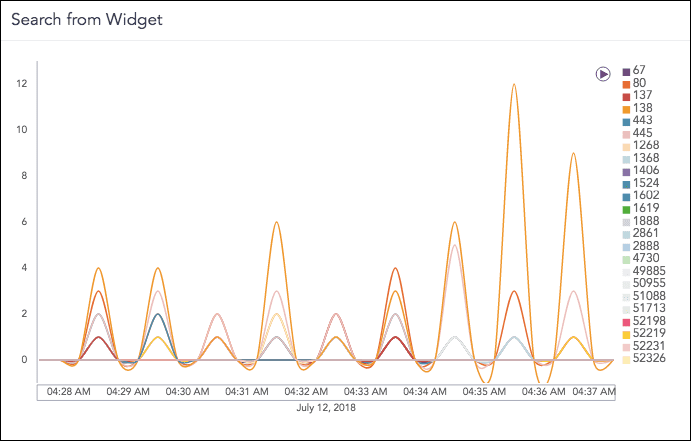
You can toggle between edit and non-edit mode. In edit mode, you can select the graph type, for example Clustered Line Chart, Stacked Column Chart, and Tables. In non-edit mode, you can drill down.
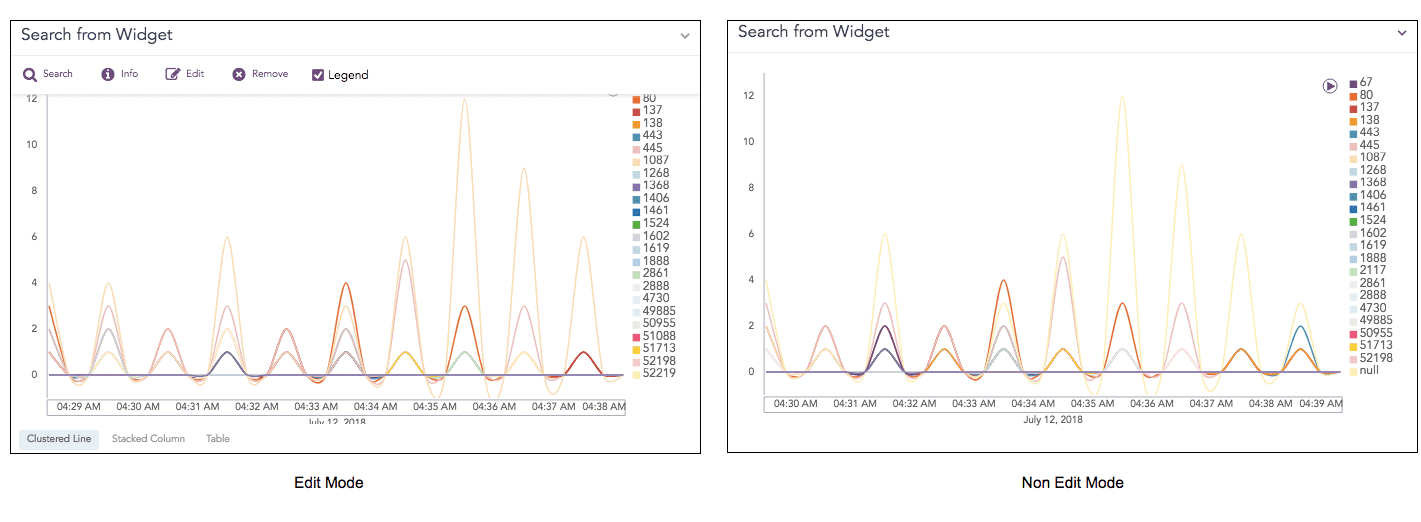
Edit and Non Edit Mode
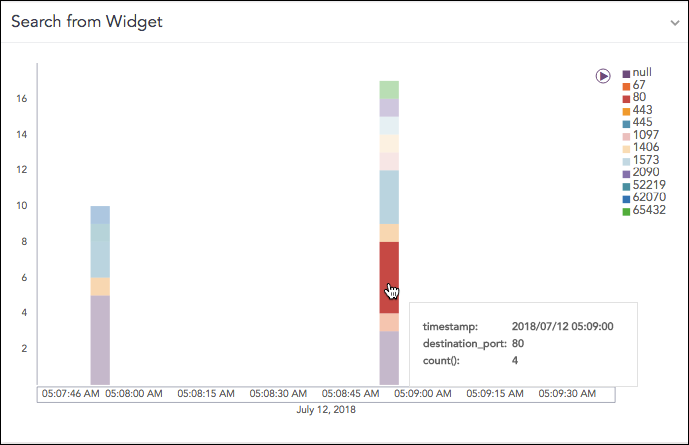
Select destination_port: 80 and count(): 3 for to drill down.
Drilldown
When you click on the highlighted result, you get the option to drill down one of the following specific parameters:
Filter
Drill down by
Top 10 drill-down by
The Filter drilldown searches on Range, destination_port and count(). The Drilldown by and Top 10 drill-down searches for the destination_address.
The results of all three drilldown types can be opened and viewed in the same window or a new window. Enable Range.
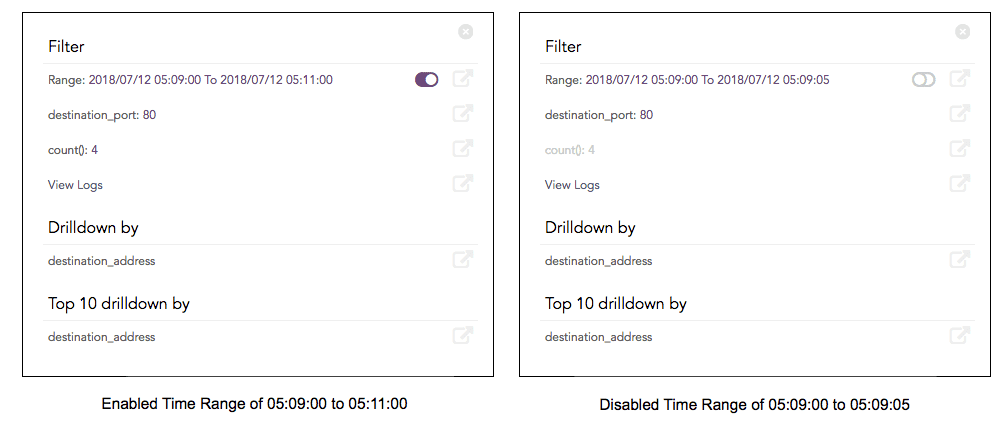
When drilling down on the Range value, the results opens on the same page.
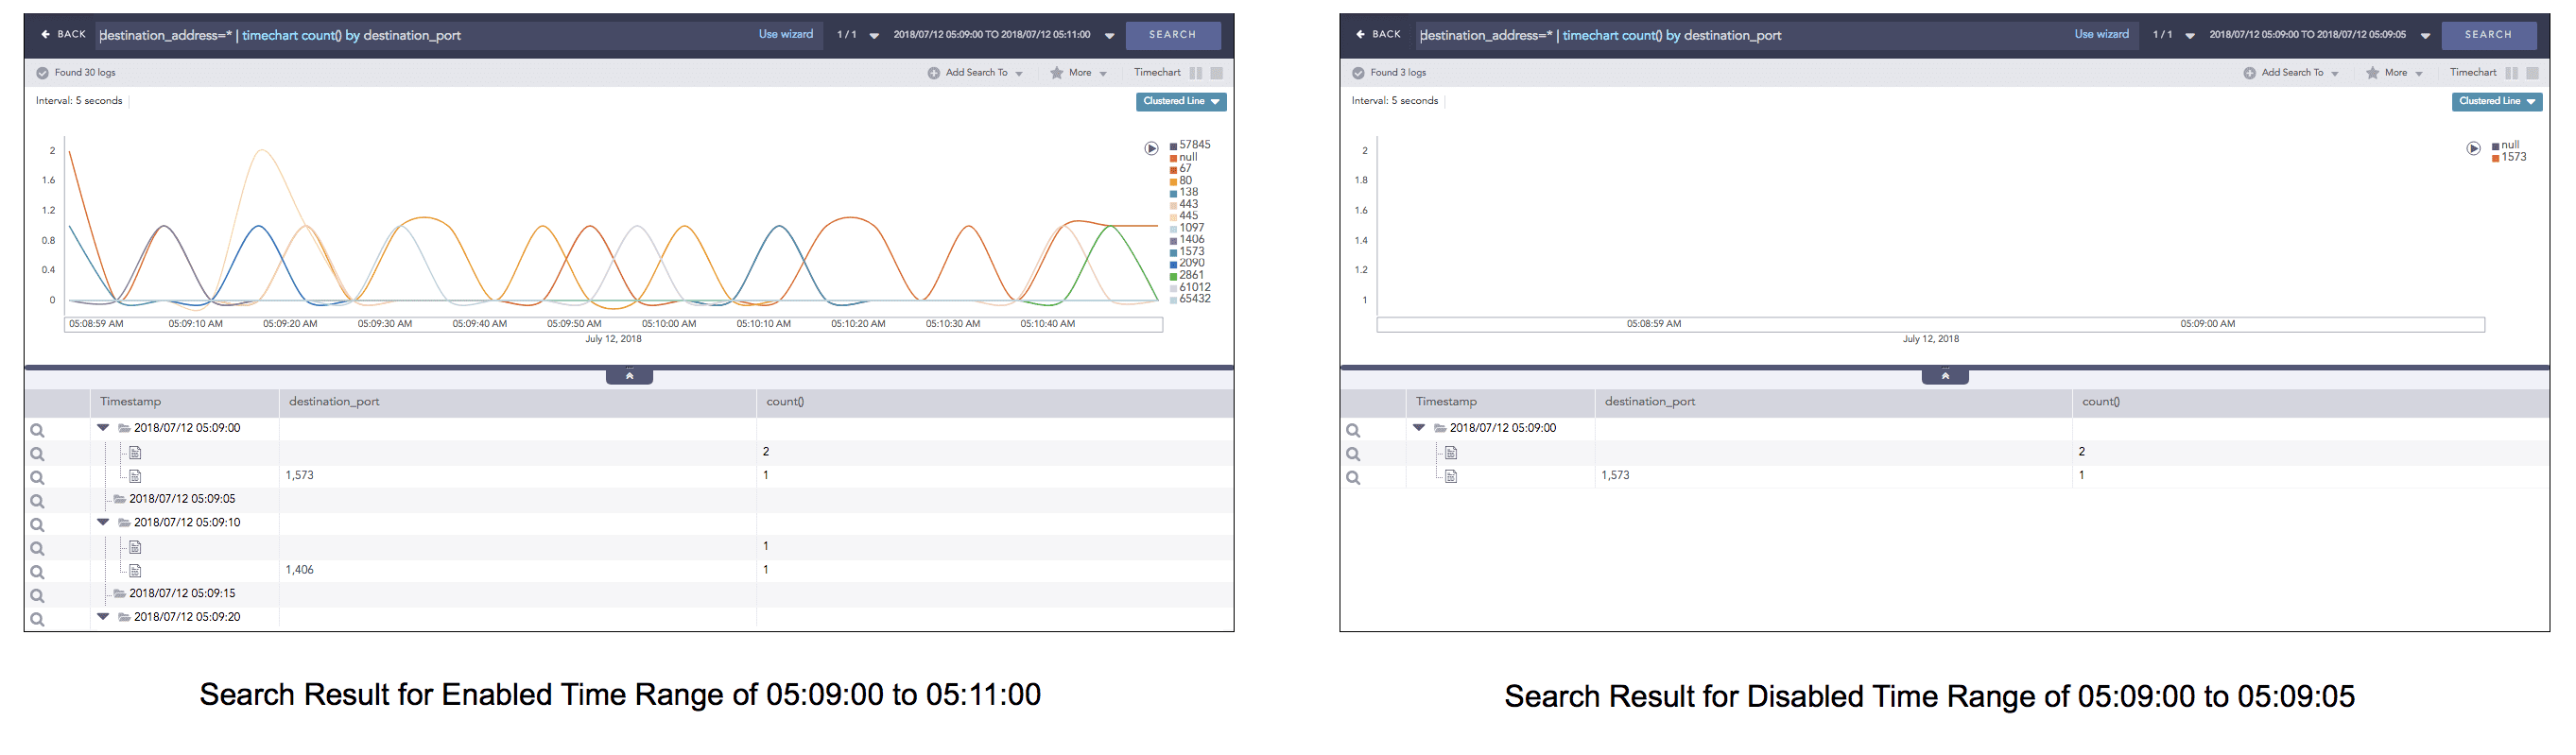
When drilling down on “destination_port”=138, the results for the destination port opens in the same page.
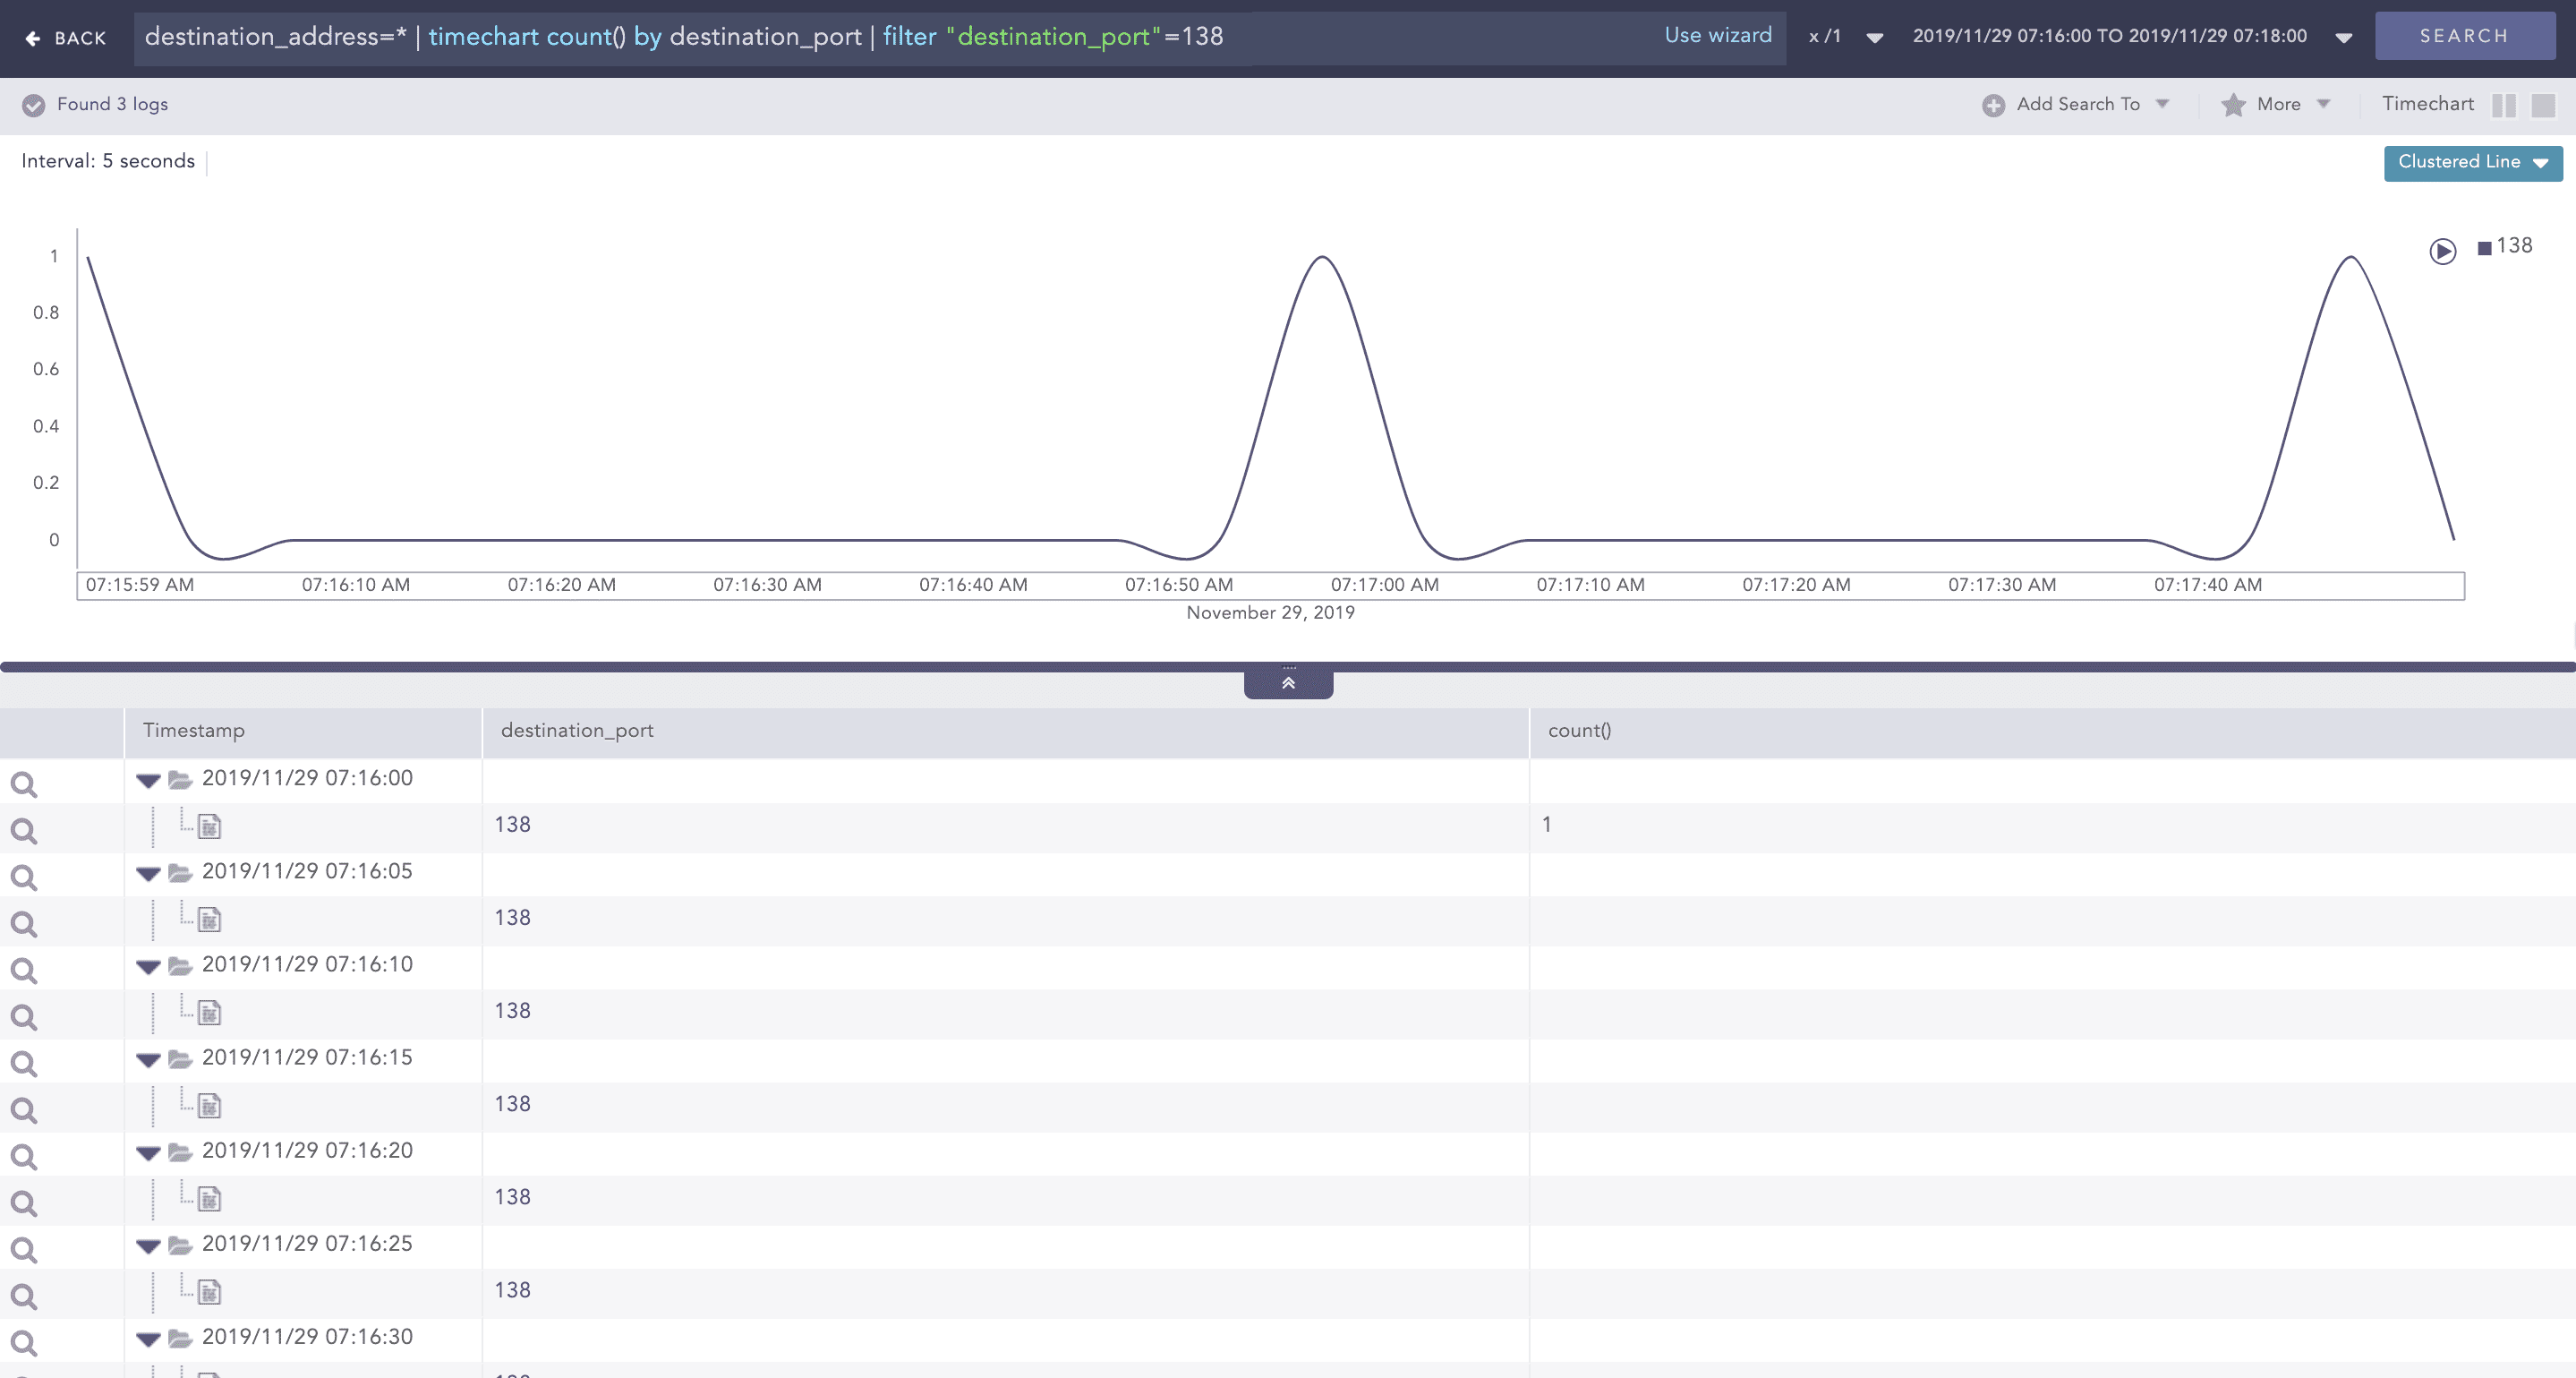
Drill down on destination_port
When the drilling down is carried out on “count()”=3, the search results for the count open on the same page.
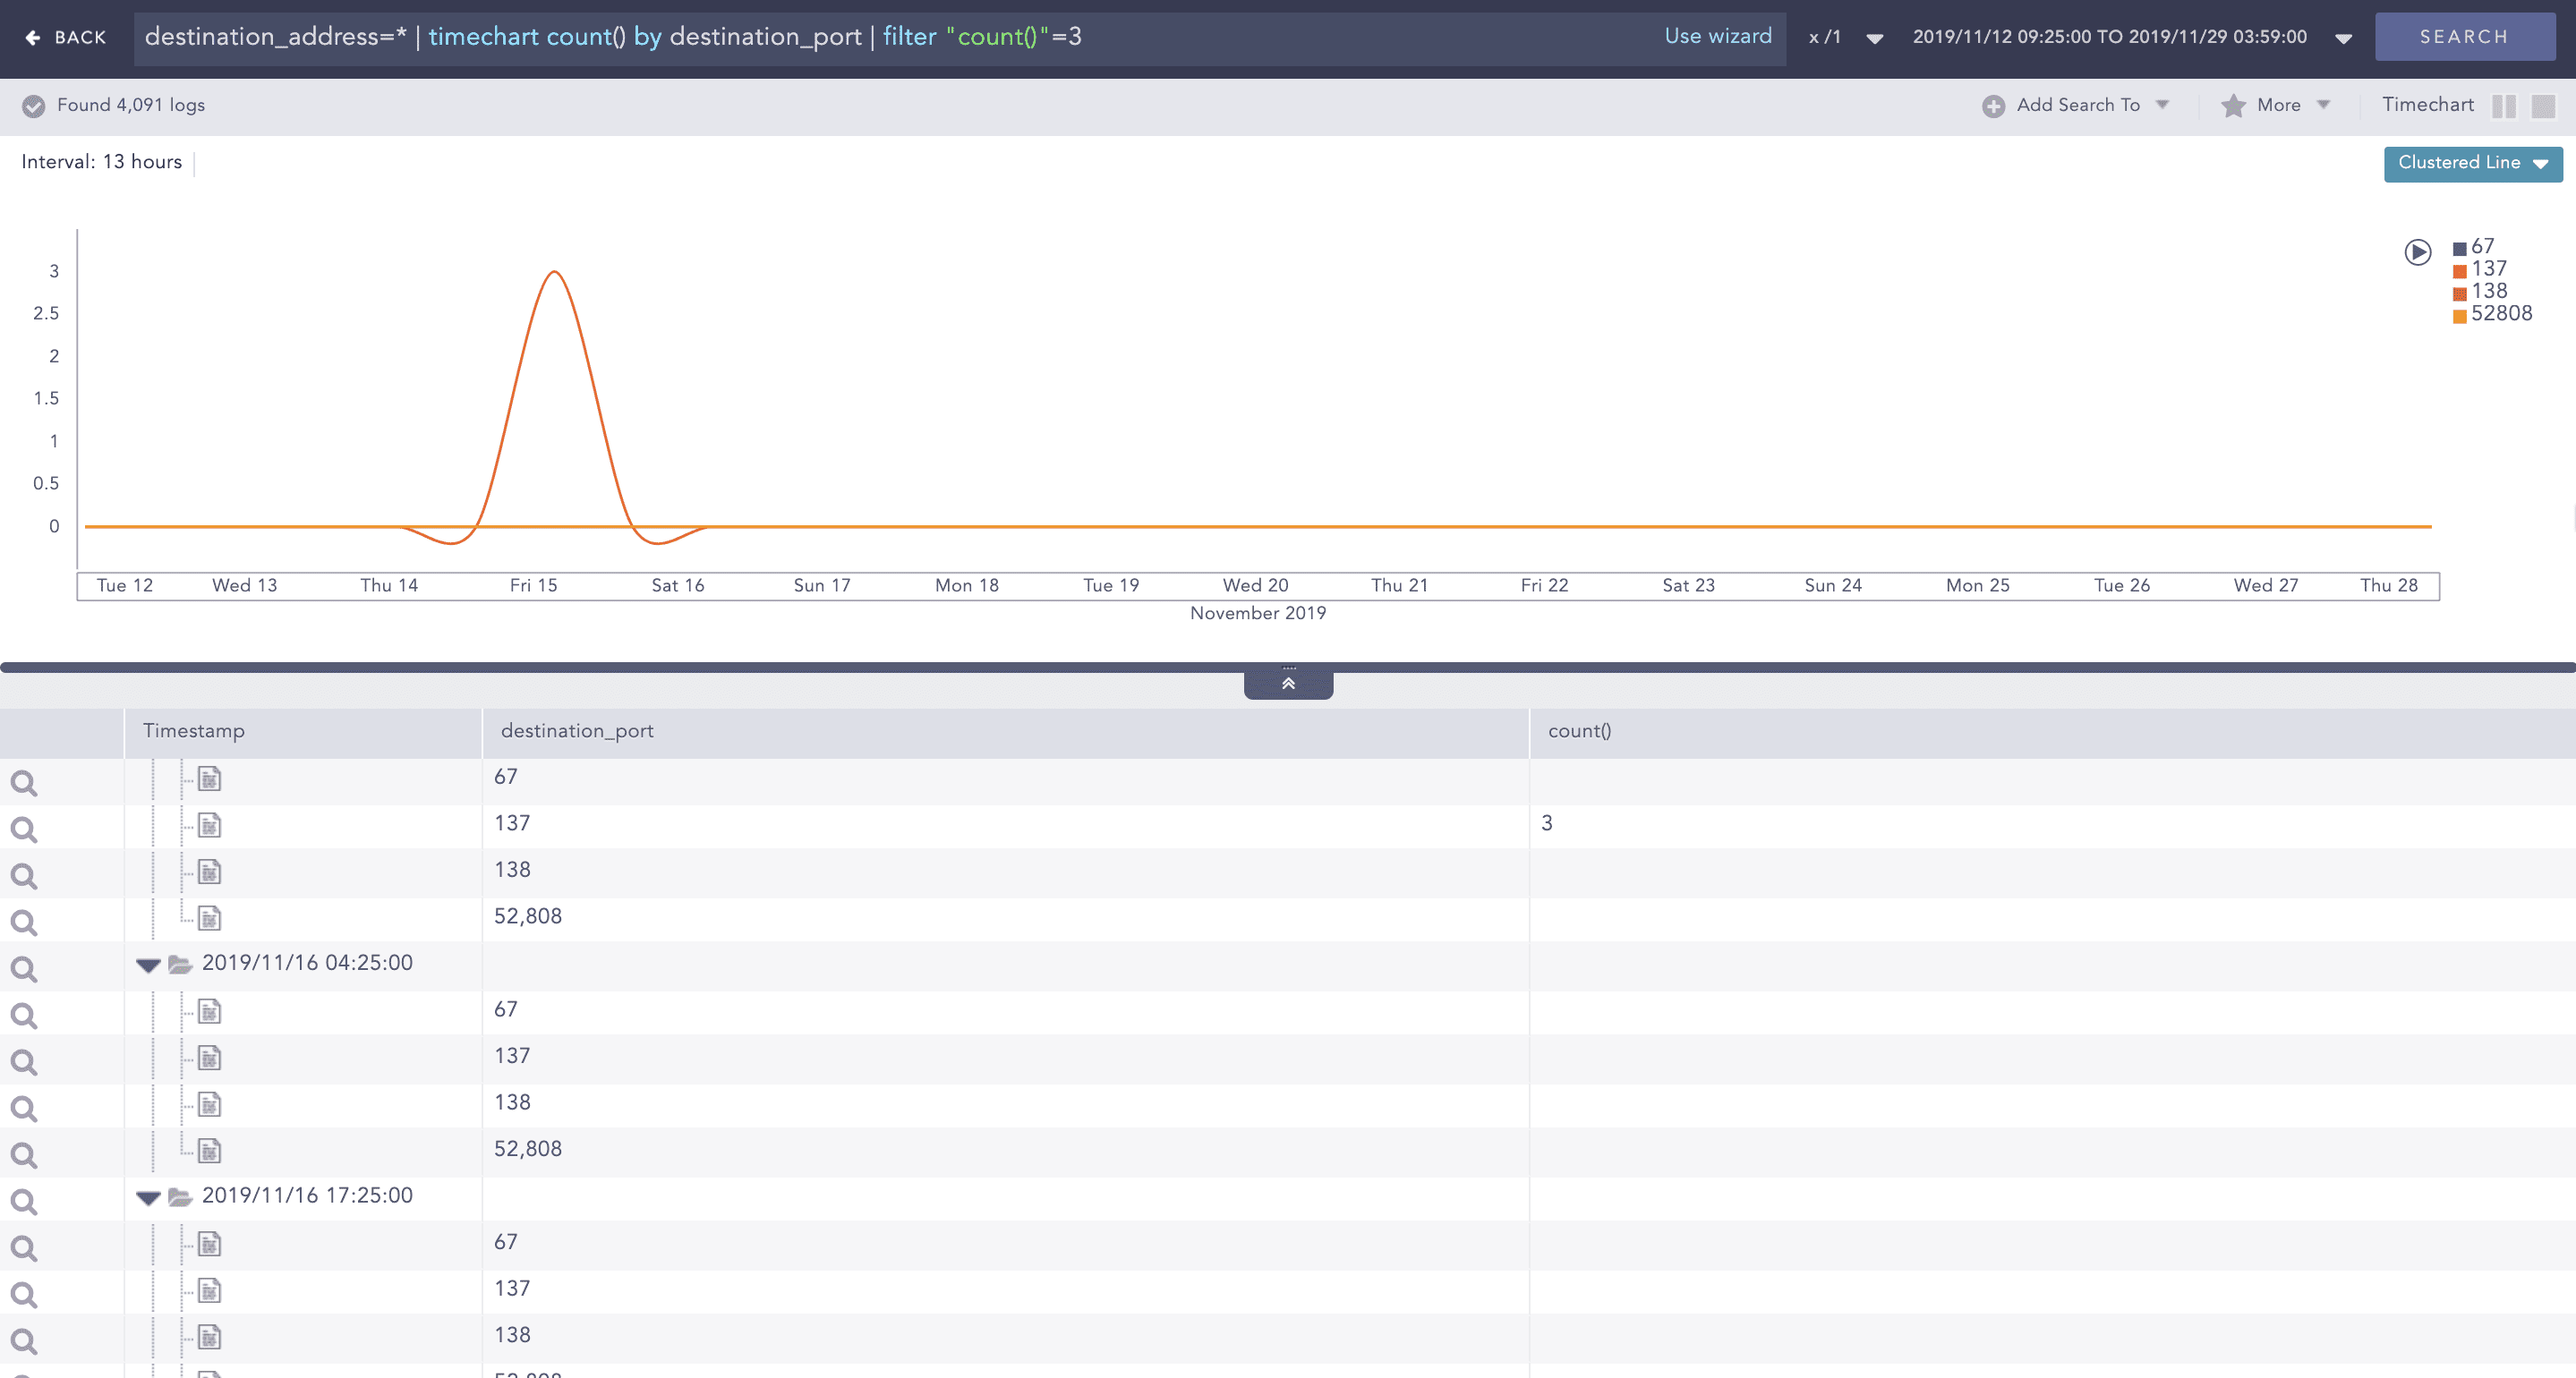
Drill down on count()
When drilling down on destination_address, the results open in the same page.
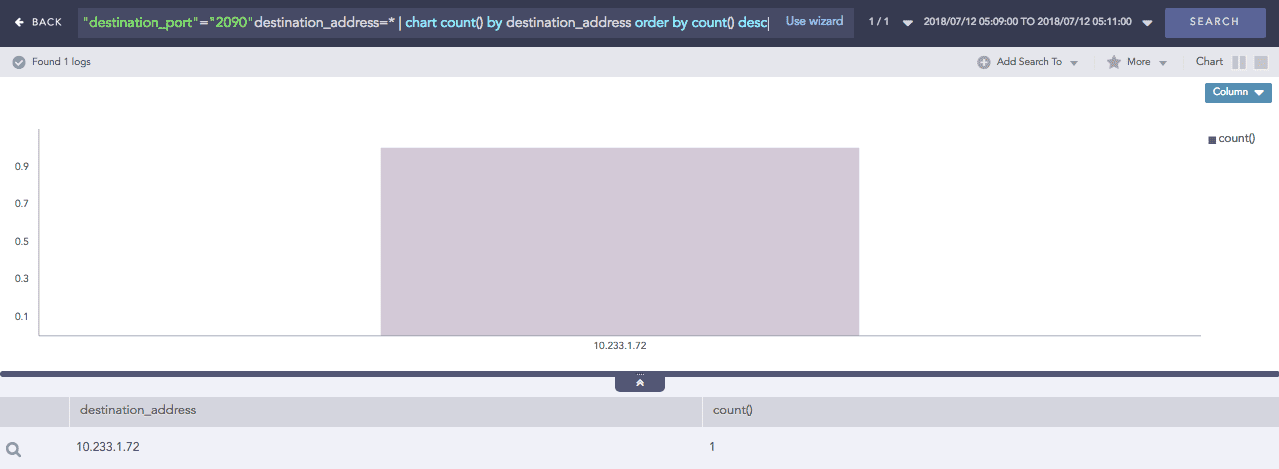
Drill down on destination_address
When drilling down on the destination_address, the results open in the same page.
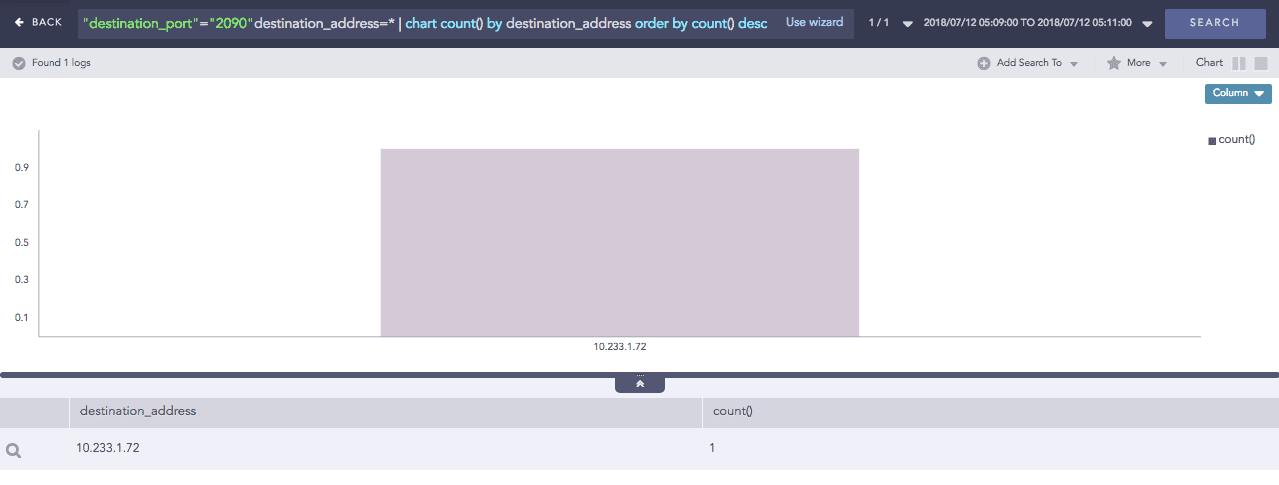
Top 10 Drilldown by destination_address
This widget has no search query.
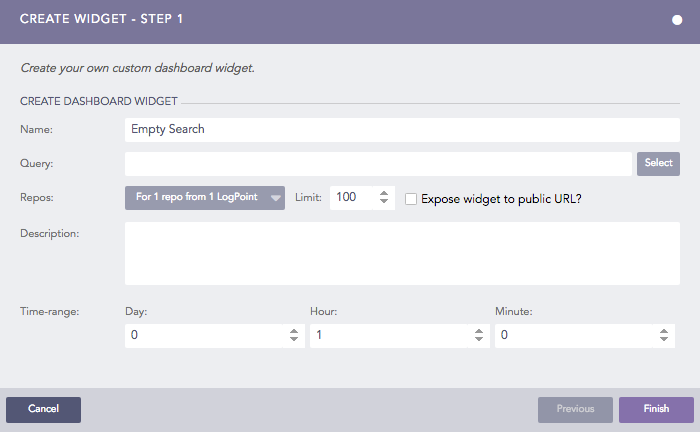
A blank query looks like this.
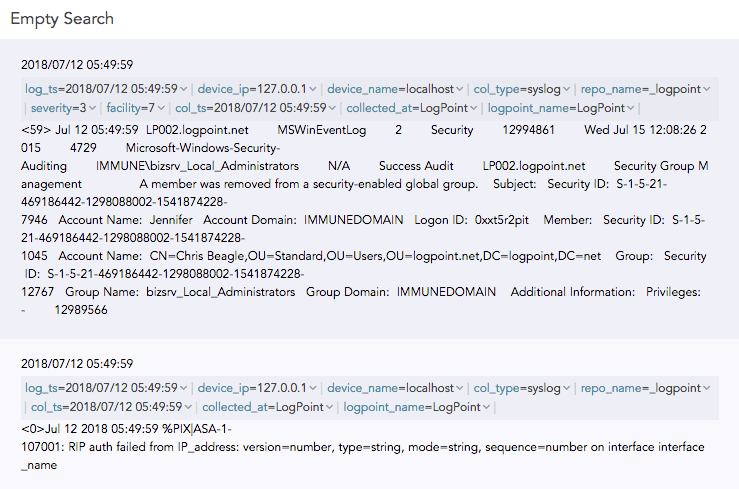
The results of a blank query are only the logs collected for the specified range of time, no graphs. You can refine the search query by clicking the on specific parts of the search results, for example key-value pair, or a raw log message. This starts a of search based on the selected parameter.
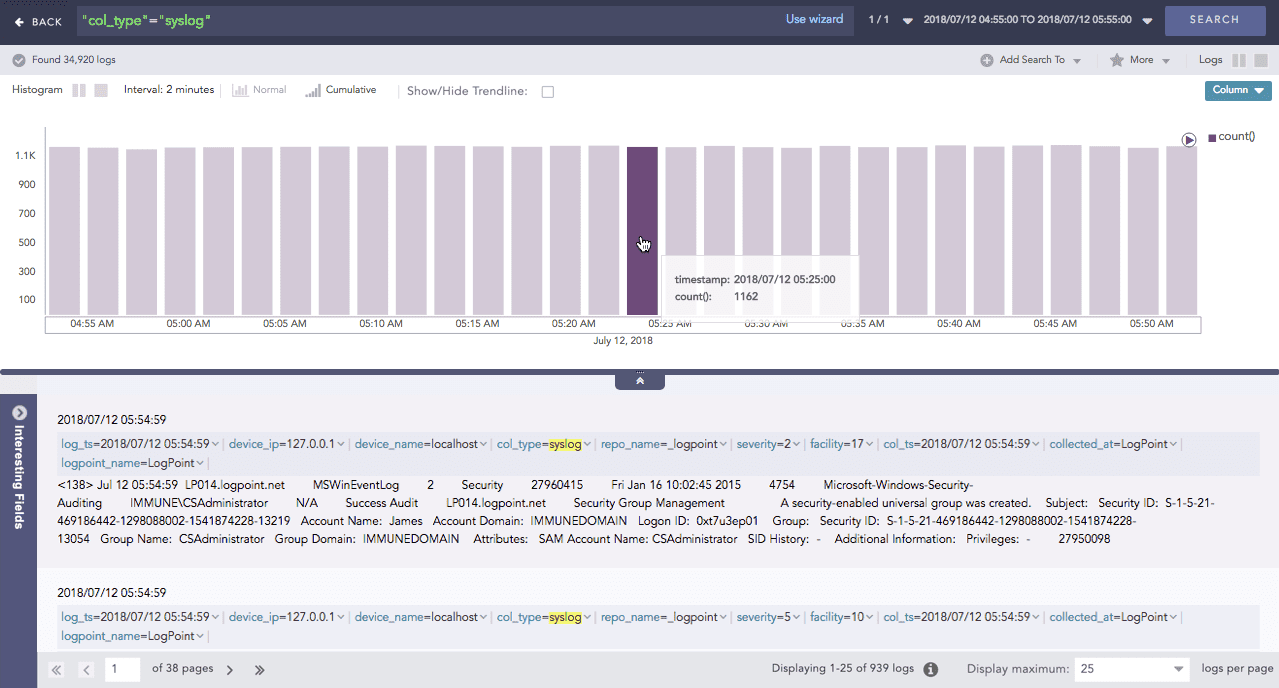
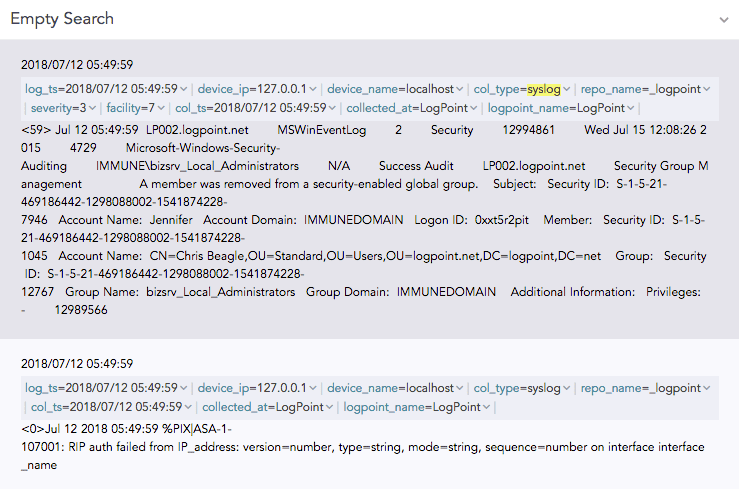
For example, if you click syslog:
This opens the search result of the query “col_type”=”syslog”. The graph used depends on what you select.
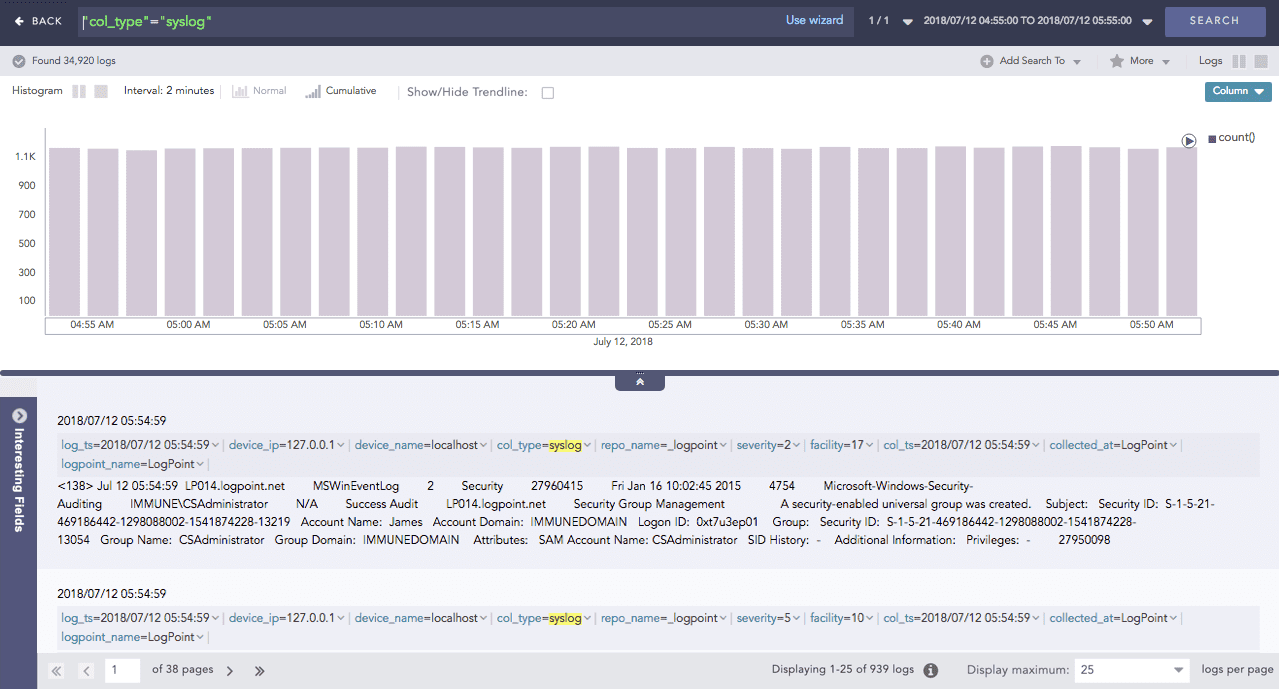
Now you can drill down. When you hover a specific part of the search results, you can drill down to get more details.